In modern HMI systems, Trend Graphs play an important role in monitoring production processes visually and effectively. Instead of relying solely on instantaneous numbers, trend charts provide a comprehensive picture of changes in important parameters in real-time or historical data. So what are Trend Graphs in HMI, what types are there, what benefits do they bring to businesses, and how to deploy them? Let’s find out the details with XINJE in this article!
What are Trend Graphs?
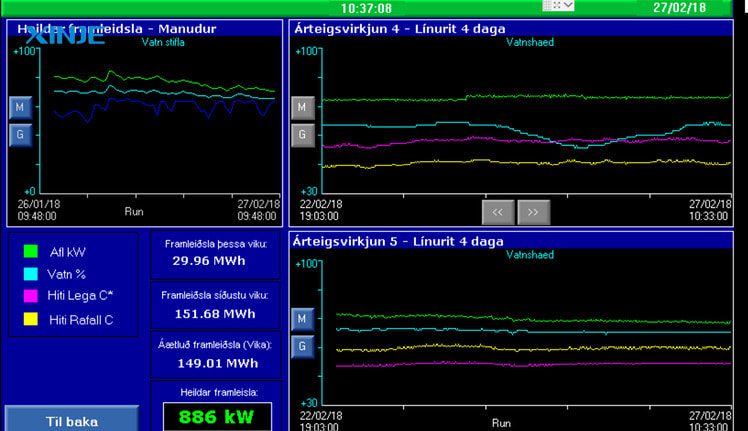
Trend Graphs are data visualization tools in the HMI (Human Machine Interface) interface. This is a graph that represents the change of one or more parameters in real time or historical data.
Trend Graphs often display important signals such as temperature, pressure, motor speed, liquid level, etc. so that operators have an overview and can easily monitor fluctuations in the production process.
What is the role of Trend Graphs in the HMI interface?
In HMI, Trend Graphs act as a “window” reflecting the operating status of equipment, lines or the entire factory. Instead of just looking at instantaneous numbers, trend graphs help engineers, technicians and managers:
- Monitor the continuous change of important parameters.
- Detect abnormal signs early, predict potential problems.
- Make timely adjustment decisions to maintain stable operations.
- Store operational data as a basis for reporting, performance analysis or periodic maintenance.
Thanks to Trend Graphs, the HMI interface is not only a dashboard but also a tool to support decision making based on real data.
How many main components are there in a Trend Graph?
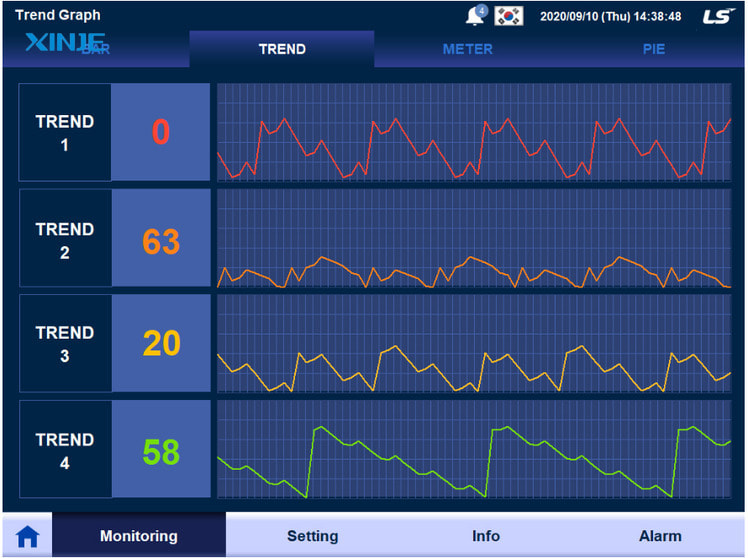
A Trend Graph in an HMI usually includes 5 basic components:
- Time Axis: This is the horizontal axis (X-axis) that displays the observation period. Operators can customize the time period to view past data, zoom in or out to observe details or overview.
- Value Axis: The vertical axis (Y-axis) represents the measured values of signals (temperature, pressure, current, etc.). Depending on each signal, the value axis can be scaled appropriately to ensure easy observation.
- Trend Line: A line drawn to represent the change of the signal over time. A Trend Graph can display multiple trend lines at the same time to compare different signals on the same chart.
- Filters and data channel selection: HMIs often allow users to choose which signals to display, turn signal channels on/off, or filter signals according to specific conditions for easy observation.
- Navigation features: Modern Trend Graphs support tools such as: zoom in/out, move (pan), display detailed values at each data point, mark (marker) or take snapshots for storage.
How many types of Trend Graphs are there in HMI?
Trend Graphs in HMI are usually divided into two main groups based on display purposes and data sources: Real-time Trends and Historical Trends. Each type serves different needs in monitoring and analyzing operations.
Real-time Trends
Real-time Trends is a type of graph that displays instantaneous data, continuously updating measured values from devices or sensors. This type of graph helps operators:
- Monitor important parameters at the time of operation.
- Quickly detect abnormal fluctuations, helping to promptly handle emergency situations.
- Easily adjust operating parameters directly on the HMI interface.
Real-time Trends are often applied to processes that require close monitoring such as: controlling temperature in boilers, monitoring conveyor speed, solution level in tanks, or motor current.
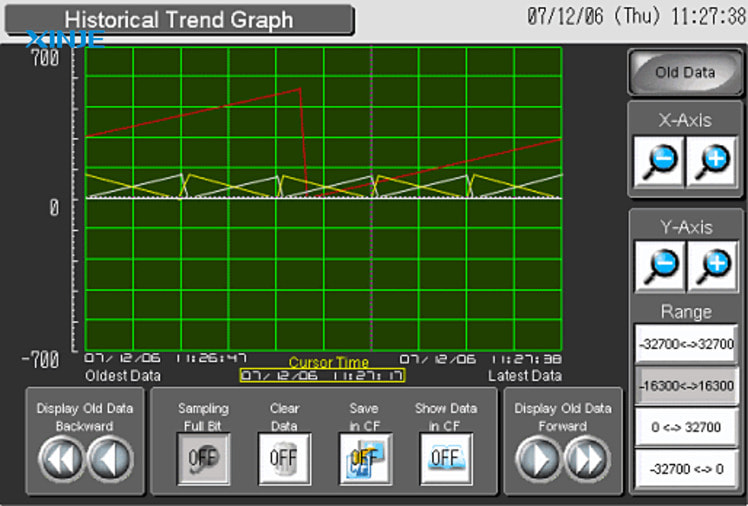
Historical Trends
Historical Trends store and display recorded parameters over a period of time. This type of chart is important for:
- Long-term operational analysis.
- Product quality or production reporting.
- Tracing the origin of data to determine the cause of errors or incidents.
Historical Trends are usually stored on HMI memory, SCADA servers or cloud storage systems. The food, pharmaceutical, energy and beverage industries are typical fields that always need Historical Trends to ensure strict quality standards.
What are the benefits of Trend Graphs in HMIs?
Trend Graphs bring many practical values to both operating engineers and production management teams. Here are some of the key benefits:
- Continuous and accurate monitoring: Trend Graphs allows real-time data display, making it easy for operators to grasp changes in important parameters such as temperature, pressure, speed, etc.
- Early detection of potential problems: When observing data in graph form, unusual trends will be easier to identify than just looking at numerical values. Just a signal exceeding the threshold or unusual fluctuations will also be clearly displayed on the graph
- Increasing the ability to make data-based decisions: Trend Graphs act as “proof” of operation, helping engineers and managers have a clear basis when needing to adjust processes, change machine parameters or propose new equipment investments.
- Support reporting and tracing errors: Historical data stored through Trend Graphs helps trace the cause when errors, incidents occur or when customers need proof of production quality.
- Process analysis and optimization: Factories can compare operating data between shifts, lines, or different production stages to find out the unreasonable points and propose suitable improvement plans.
What are the common errors when using Trend Graphs?
Although Trend Graphs is a very useful data visualization tool, in actual operation, users may encounter some common errors that make monitoring and analyzing data less than optimal. Here are some common problems:
- Data not updating in real time: A fairly common error is that Trend Graphs does not display new data, or displays it slowly compared to the actual value. The cause is often due to an inappropriate signal sampling rate, or the connection between the HMI and PLC/Sensor is interrupted.
- Lack of historical data: Many Trend Graphs systems are not configured to store data for a long enough time or do not have a backup data memory.
- Wrong signal or display parameters: If the operator configures the wrong signal source or selects the wrong data channel, Trend Graphs will display incorrect parameters. This can lead to incorrect monitoring, incorrect adjustments, and even serious operational errors.
- Overly complex interface, difficult to follow: When displaying too many signals on the same Trend Graph without proper grouping or filtering, the HMI screen can become confusing.
To minimize the above errors, businesses should:
- Ensure correct signal configuration, sampling frequency and measurement scale.
- Periodically check device connections.
- Use HMI with reliable data storage and backup features.
- Train operational personnel to use and monitor Trend Graphs most effectively.
Conclusion
Trend Graphs is not just a simple data visualization tool but also plays a key role in monitoring, analyzing and optimizing production processes.
Integrating Trend Graphs into HMI helps businesses easily monitor parameter fluctuations in real time, detect risks early, store data for reporting and make decisions based on real data.
In the context of factories becoming increasingly automated and digitalized, Trend Graphs becomes an indispensable visual solution to improve operational efficiency, ensure product quality and maintain competitiveness.